React, events, bubbling, fetching, and SVG
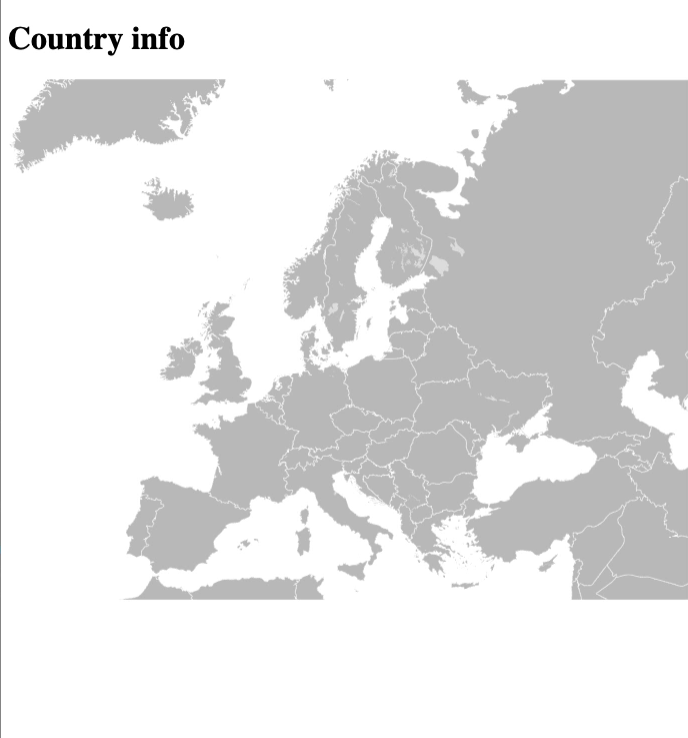
The task is to create a web-page in React with a map of Europe which, when a country is selected with a mouse click, should highlight the country and print details about the country as sketched below. The country data will be fetched from an API.
The assignment might be a bit ambitious after only one day of learning React, so this is to get you started:
- Introduction and SVG beind the scenes
- Start React project and get the map working
- The rest is up to you.
Instructions and hints are also given in text format below:
1. Create a new React app
Use Vite to create, and then remove irrelevant code from the source code.
2. Download the map and take a peak
Download this file countries_europe.svg. An svg image is a textbased format, that can be viewed in a browser (try to open countries_europe.svg in Chrome). SVG is an acronym for Scalable Vector Graphics. This means that the drawings are represented as curves, that are perfectly scaleable. This is not the case with bitmap graphics formats as jpg, png, and such.
3. Study the SVG file format
Try to look at countries_europe.svg in a texteditor (use VS Code). Do it by dropping the file into the assets folder in the React project. Notice this:
-
The data format is
xml. Which means that theelementsortagshasattributesand a beginning and an end. It looks likehtml, buthtmldoes not always need and end-tag. -
Each country is represented by a
<path>element that has these attributes:d: the path or curves to be drawn - “the country border”. Look at the documentation if you fancy the details.id: the ISO-country code. For Denmark it isid="dk"style: the css style of the line drawing
4. Fetching country data
Luckily, the REST API given here: https://restcountries.com/v3.1/alpha/de uses ISO-country codes as well. The endpoint responds with a JSON encapsulated data package with all the information needed (+ a lot more) to fill out the details (just test the link above in a browser).
So the exercise boils down to:
5.1 Hook up an event handler on the map and use event bubbling instead of adding a handler to each country.
5.2 Get the id, perform an AJAX request to fetch the JSON-data from the link given above and update the GUI using the JSON returned as sketched above.
5. Hints
5.1 Since the project is done in React, we need to insert the svg-image into a component in jsx format. At least that´s one way to do it. An easy way is to use the transform.tools converter:
- Open the svg file in the text editor and copy all to the clipboard.
- Open this page transform.tools, pick
SVG to JSX, and paste the svg-source into the form to convert. - Copy the converted React JSX code into a new file and name it the same as the component:
SvgComponent
5.2 Hook up a click-handler on the overall map (id =svg2), and in that, find the id for the actual element that was clicked (= the country code) via the target property of the event handler.
5.3 Change the colour of the selected country by changing its fill property.
5.4 You might want to use a useState for holding the currentCountryCode, and when the country code changes, then fetch the corresponding data from the external api. A good way would be to create a useEffect with [currentCountryCode] as a dependency. In that way the useEffect will be evoked on updating currentCountyCode.
5.5 Have fun. The result will be impressive.